This is my Assignment 2 file.
This map shows the amount of property damage for one types of crashes which is Fatal Crashes:

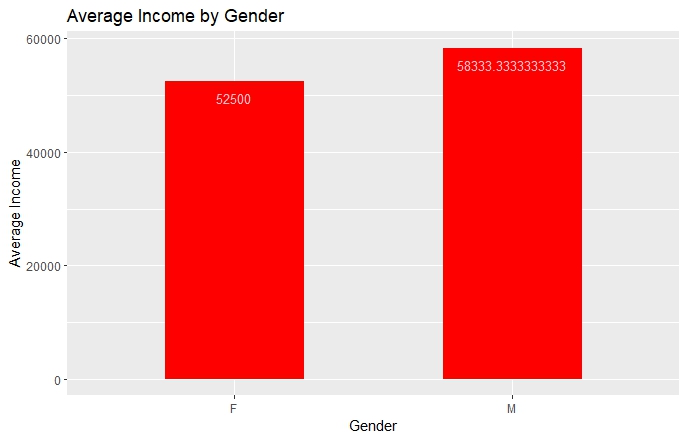
This bar chart shows the average income by gender of my simple data:
This map shows the amount of property damage for one types of crashes which is Fatal Crashes:
This bar chart shows the average income by gender of my simple data: